🏡 Brantford Real Estate Market Update – February 2025
As we enter February, the Brantford real estate market is showing signs of stability, opportunity, and momentum. While January started slow—partly due to seasonal trends, a cold snap, and global political distractions—the fundamentals of the market remain strong.
With borrowing conditions much better than in the last two years and buyer demand expected to ramp up in the coming weeks, 2025 is shaping up to be a year of price growth and increased competition for desirable homes.
Let’s dive into the numbers and key trends shaping the market right now.
📈 Sale Prices Holding Steady with Signs of Growth
Median Sale Price (January 2025): $613,000
Change from last month: +0.7%
Change from last year: +3.0%
After significant fluctuations over the past few years, Brantford’s home prices have remained remarkably stable for nearly a year. With borrowing conditions improving, we expect price growth in 2025—though not at the breakneck pace of past booms.

Median Sale Price In January by Property Type:
Detached homes: $693,750
Townhomes: $574,750
Condos: $339,400
While affordability remains a challenge, buyers are gaining confidence in their ability to move forward, thanks to lower mortgage rates and expectations of continued rate reductions throughout the year, making homeownership more feasible than in 2022-2023.
❄️ Buyer Demand Was Low in January—But That’s Normal
Total Homes Sold in January: 66
Down 21% from December
Down 12% from last year

January was one of the slowest months for home sales in recent history, but there are several reasons for this:
Bitterly cold weather likely kept buyers from actively shopping.
November and December were unusually busy, meaning some buyers made their moves earlier.
Political distractions (both in Canada and the U.S.) have kept some buyers on the sidelines.
However, the slowdown isn’t a long-term trend. If history is any guide, demand typically ramps up sharply in February and March, peaking in April.
🔹 2024 had the lowest demand in a decade, but home prices still held steady. This means that even with lower sales volumes, there’s enough buyer activity to support pricing.

Who’s Buying?
The strongest demand is in the $400K-$800K range:
✅ Homes under $400K are scarce (mostly condos or fixer-uppers).
✅ The sweet spot is between $500K-$800K, where most first-time buyers and move-up buyers are active.
❌ Homes over $1M are selling more slowly, as they rely on out-of-town buyers who haven’t fully returned to the market.
🆕 New Listings Are Up—But Many Are Re-Listings
New Listings in January: 169
+86% from December
Flat compared to last year
At first glance, 169 new listings seem like a surge in supply. But 38% of these were actually re-listings—homes that didn’t sell in late 2024 and were put back on the market.
This means the real supply of fresh new homes is much lower than it appears.

Key Takeaway:
New listings are keeping pace with demand in most price ranges.
Higher-end homes ($900K+) are seeing supply outpace demand, leading to slower movement.
The metric to watch isn’t new listings—it’s inventory.
📦 Inventory is High, But Not Out of Control
Total Homes for Sale: 285
Up 4.7% from last month
Up 16.8% from last year
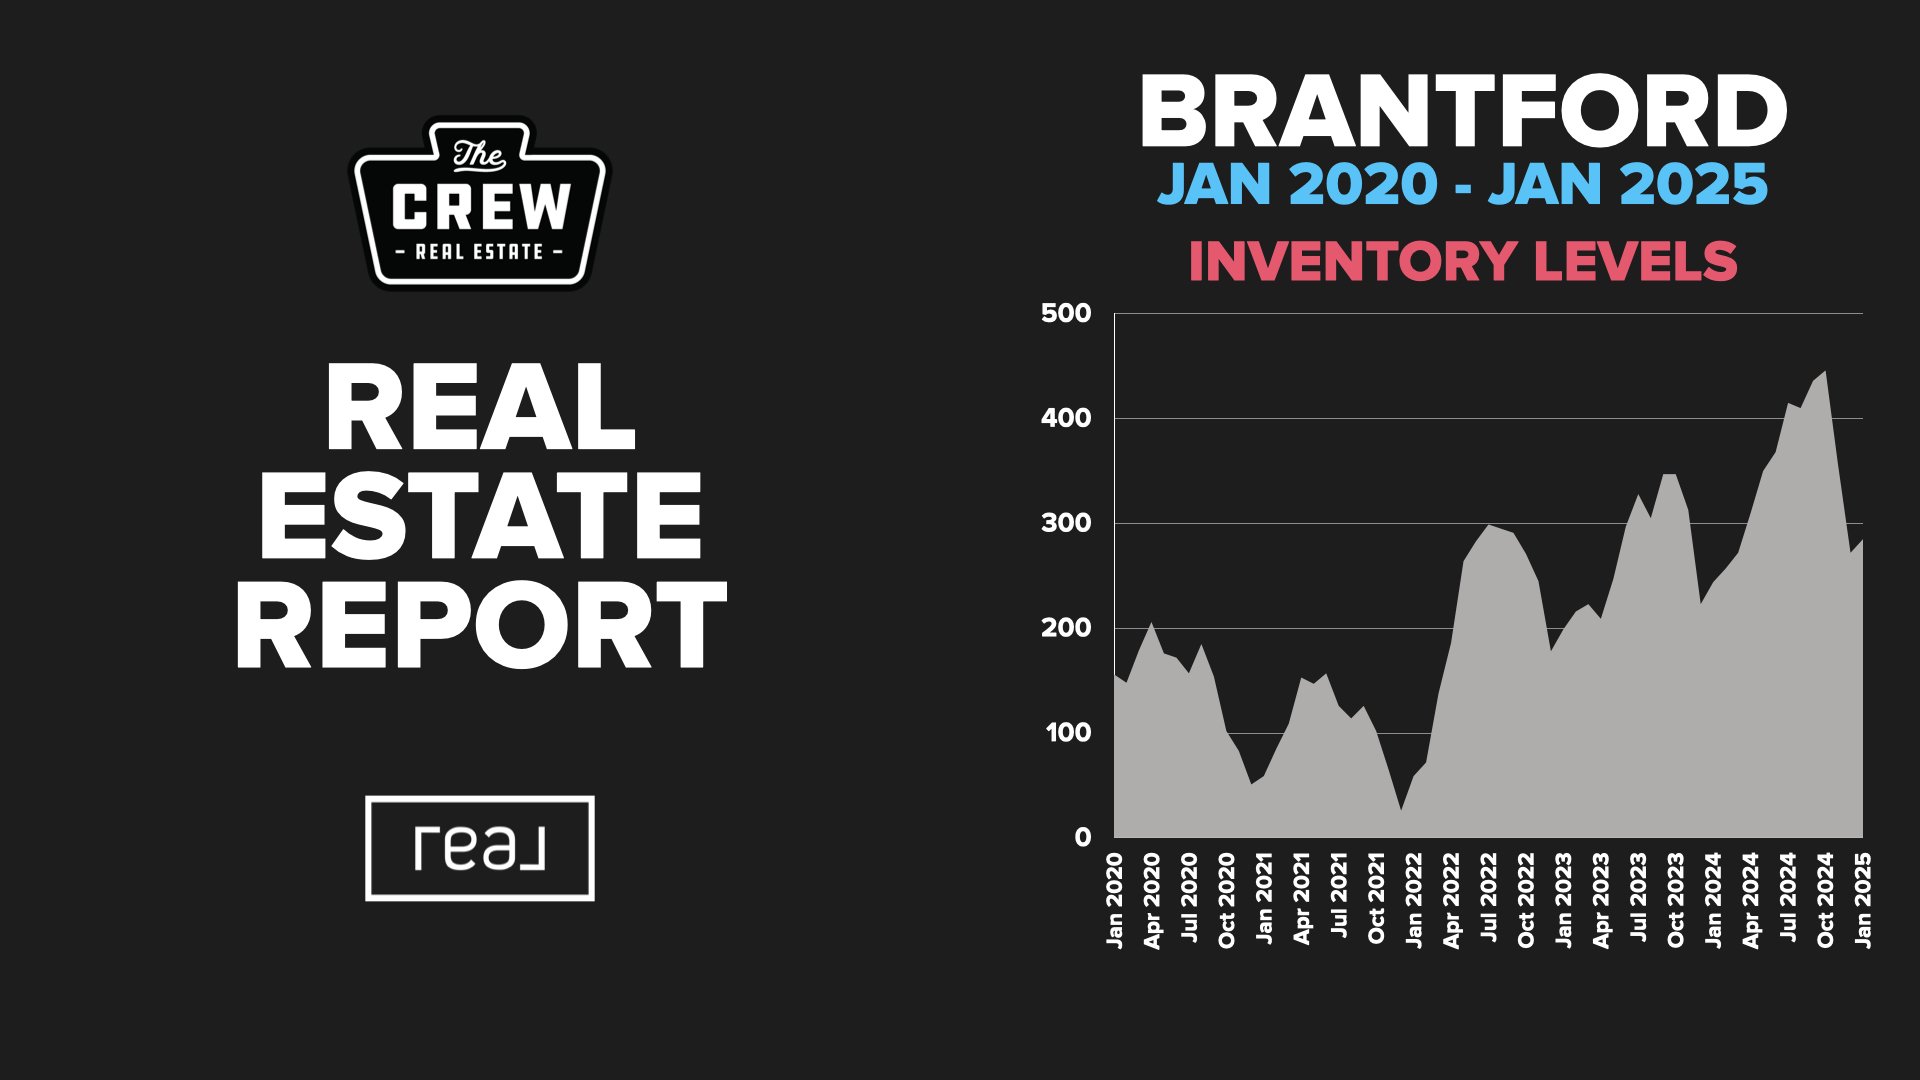
With only 66 sales in January, inventory levels are climbing. This isn’t necessarily a bad thing—it just means buyers have more options.
🔹 The key question: Will rising demand in February/March slow down inventory growth?
Our expectation:
Inventory will likely peak and then start declining in spring as more buyers enter the market.
The highest supply is in the upper price points, while the lower and mid-range segments remain competitive.

⏳ Months of Supply & Market Speed
Months of Supply: 2.4 months
Time to Sell: 43 days (up slightly from last month)
While the market cooled slightly in January, it’s still moving faster than last year:
✅ 42% of homes sold in under 30 days
✅ 47% sold in 30-90 days
✅ Only 11% sat for over 90 days
This suggests that well-priced homes are still selling quickly, while overpriced or less desirable listings linger.

💰 Offers & Sale Prices
Homes sold at 99% of asking price on average
Higher than last month and last year
36% of homes sold at full price or higher
Only 11% sold for more than 5% off the asking price
This is a clear indicator that the market is gaining strength. Buyers are still negotiating, but strong offers are being made—especially on well-presented homes.

🔮 Final Thoughts & What’s Next
The Brantford real estate market turned a corner in January, and while it started slow, momentum is building.
Prices are stable and expected to trend up modestly.
Demand is rebounding, especially in the mid-range market.
Inventory is higher but should decline as buyer activity picks up.
Homes are selling faster than last year, with fewer steep discounts.
🚀 Looking ahead: February and March will be crucial months to watch. Stay tuned for next week’s update, where we’ll break down the hottest and coldest segments of the market!